by Einar Landre
Lead Analyst, Equinor emerging digital technologies
Prelude
The OSDU™ Data Platform is the most transformative and disruptive digital initiatives in the energy industry. Never before have competitors, suppliers and customers joined forces to solve a common set of problems taking advantage of open-source software licensing, agile methods and global collaboration.
Originally OSDU was an acronym for Open Subsurface Data Universe, directly derived from Shell’s SDU (Subsurface Data Universe) contribution. There is great video presenting Shell’s story that can be found here. The OSDU™ Forum decided to remove the binding to the subsurface and to register OSDU as trademark owned by The Open Group paving the way for adaptation beyond subsurface, enabling constructs like:
- OSDU™ Forum – the legal framework that govern community work
- OSDU™ Data Platform – the product created by the forum
The OSDU™ Forum’s mission is to delivers an open-source, standards-based, technology-agnostic data platform for the energy industry that:
- stimulates innovation,
- industrialises data management, and
- reduces time to market for new solutions
The mission is rooted in clearly stated problems related to digitalisation of energy and the journey till today is summarised below:
2016 – 2017
- Increased focus on digitalisation, data and new value from data in the oil and gas industry
- Oil and gas as companies make digital part of their technology strategies and technical roadmaps
2018-2019:
- Shell invites a handful oil and gas companies to join forces to drive the development of an open source, standardised data platform for upstream O&G (the part the find and extract oil and gas from the ground)
- The OSDU™ Forum was formally founded in September 2018 as an Open Group Forum based on Shell’s SDU donation as the technical starting point
- Independent software companies, tech companies and cloud service providers join. Bringing the cloud service providers onboard was a strategic aim. Without their help commercialisation would become more difficult
- July 2019: SLB donates DELFI data services, providing additional boost to the forum.
2020-2021:
- Release of the first commercial version – Mercury from a merged code base is made available by the cloud service providers for consumption
2022 and beyond
- Operational deployments in O&G companies.
- Hardening of operational pipelines and commercial service offerings (backup, bug-fixing)
- Continuous development and contribution of new OSDU™ Data Platform capabilities.
The OSDU™ Data Platform was born in the oil and gas industry and it is impossible to explain the drivers without a basic understanding of the industrial challenges that made it, challenges that come from earth science and earth science data.
Earth science
Earth science is the study of planet Earth’s lithosphere (geosphere), biosphere, hydrosphere, atmosphere and their relationships. Earth science forms the core of energy, it be oil and gas, renewables (solar, wind and hydro) and nuclear. Earth science inherently complex because it’s trans-disciplinal, deals with non-linear relationships, contain known unknowns, even unknowable’s, and comes with a huge portion of uncertainty.
Hydrocarbons forms in the upper part of earth’s lithosphere. Dead organic material is transported by rivers to lakes where it sink and is turned into sediments. Under the right conditions the sediments become recoverable hydrocarbons by processes that takes millions of years. In the quest for hydrocarbons geo-scientists develop models of earths interior that help them to predict where to find recoverable hydrocarbon.
Earth models
Earth models sits at the core of the oil and gas industries subsurface workflows and are used to find new resources, develop reservoir drainage strategies, investment plans, optimise production and placement of new wells. Earth models are used to answer questions like:
- How large hydrocarbon volumes exists?
- How is the volume placed in the reservoir?
- How much is recoverable in the shortest possible time?
- As reservoirs empties, where are the remaining pockets?
- How much has been produced, from when, and how much remains?
- How to drain the volumes as cost efficient as possible?
Earth models are developed from seismic, observations (cores, well logs and cuttings) and produced volumes. When exploring new areas access to relevant datasets is an issue. Exploration wells are expensive and finding the best placement is important. Near-field exploration is easier as the geology is better known. Some production fields use passive seismic monitoring allowing continuous monitoring of how the reservoir changes while being drained. Another approach is 4D seismic, where new and old seismic images are compared.
Seismic interpretation means to identify geological features such as horizons and faults and to place them at the appropriate place in a cube model of the earth. How this is done is shown in this 10 minute introduction video.
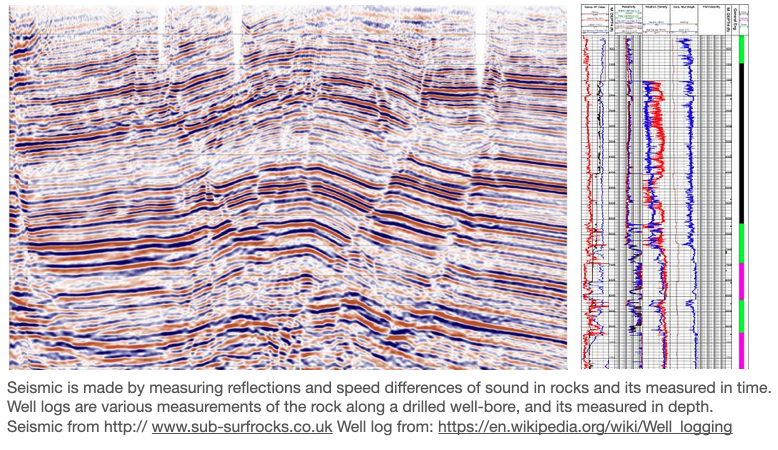
The pictures to the left shows a seismic image. To derive useful information requires special training as it is a process of assumptions and human judgement. To the right a picture of log curves and for more information about well logging please read this. Seismic datasets are very large and relatively expensive to compute. Well logs are smaller in size, but they come in huge numbers and choosing the best one for a specific task might be a time consuming process.

Timescales
Oil and gas fields are long-lived and the longevity represents a challenge on its own that is best illustrated using an example. The Norwegian Ekofisk field, discovered in 1969, put on stream in 1971, and expected to produce for another 40 years. The catch being that data acquired with what is regarded state of art technology will outlive the technology. Well logs from the mid sixties, most likely stored on paper are still relevant.
Adding to the problem is the changes in measuring method and tool accuracy. This is seen when it comes to metrological data. Temperature measured with a mercury gauge come with an accuracy of half degree celcius. Compare that with the observed temperature rise of one degree over the last hundred years. Being able to compare apples with apples become critical and therefore is additional sources of data required.
When the storage technology was paper this was one thing, now when we storage has become digital its something else. For the data to be useful a continuous reprocessing and re-packeting is required.
Causal inference
Subsurface work, as other scientific work is based on causal inference i.e., asking and answering questions attempting to figuring out the causal relationships in play.
The Book of Why defines three causation levels seeing, doing and imagination as illustrated by the figure below.

Seeing implies observing and looking for patterns. This is what an owl do when it hunts a mice, and it is what the computer does when playing the game of Go. The question asked is; what if I see… eluding to that if something is seen it might impact the probability for something else to be true. Seismic interpretation begins here with asking where are the faults while looking at the image.
Doing implies adding change to the world. It begins by asking what will happen if we do this? Intervention ranges higher than association because it involves not just seeing but changing what is. Seeing smoke tells a different story than making smoke. Its not possible to answer questions about interventions with passively collected data, no matter how big the data set or how deep the neural network. One approach to do this is to perform an experiment, observing the responses. Another approach is to build a causal model that captures causal relationships in play. When we drill a new well that can be seen as an experiment where we both gather rung one data, and also discover rung 2 evidence related to what work and what does not work. The occurrence of cavings and a potential hole collapse being one example.
A sufficient strong and accurate causal model can allow us to use rung one (observation) data to answer rung two questions. Mathematically this can be expressed as P(cake | do (coffee)) or in plain text, what will happen to our sales of cake if we change the price of coffee.
Imagination implies asking questions like my headache is gone, but why? Was it the aspirin I took? The food I ate? These kind of questions takes us to counterfactuals, because to answer them we must go back in time, change the history and ask, what would have happened if I had not taken the aspirin? Counterfactuals have a particularly problematic relationship with data because data is by definition facts. Having a causal model that can answer counterfactual questions are immense. Finding out why a blunder occurred allow us to take the right corrective measures in the future. Counterfactuals is how we learn. It should be mentioned that laws of physics can be interpreted as counterfactual assertions such as “had the weight on the spring doubled, its length would have doubled” (Hooke’s law). This statement is backed by a wealth of experimental (rung 2) evidence.
By introducing causation the value of useful data should be clear. Without trustworthy data, that we are not able to agree about what we can see, there cant be any trustworthy predictions, causal reasoning, reflection and action. The value of a data platform is that it helps with the data housekeeping at all levels. Input and output from all the three rungs can be managed as data.
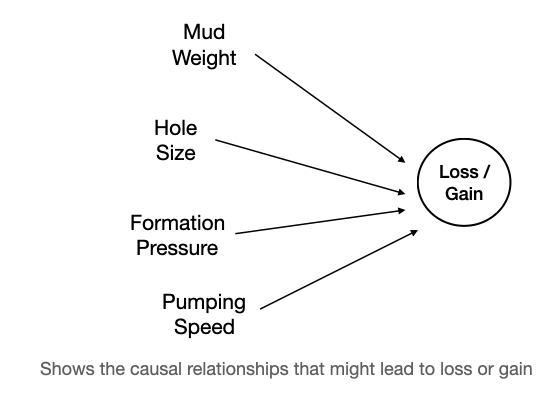
Causal models are made from boxes and arrows as illustrated in the figure below. How the factors contributes can be calculated as probabilities along the arrows. The beauty of causal models is that their structure is stable, while the individual factors contribution will change. Loss mean that mud leaks into the formation due to overpressure, and gain implies that formation fluids leaks into the wellbore. Both situations are undesired as they might lead to sever situations during drilling.

Finally, dynamic earth modells based on fluid dynamics captures causal relationships related to how fluids flow in rock due to the laws of physics.
Einar Landre is a practicing software professional with more than 30 years’ experience as a developer, architect, manager, consultant, and author/presenter. Currently working for Equinor as lead analyst within its emerging digital technologies department. He is engaged in technology scouting, open source software development (OSDU) with a special interest for Domain Driven Design, AI and robotics. Before joining Equinor (former Statoil), Mr. Landre has held positions as consultant and department manager with Norwegian Bouvet, Development manager of TeamWide, technical adviser with Skrivervik Data (SUN & CISCO distributor) and finally software developer with Norsk Data where he implemented communication protocols, operating systems and test software for the international space station.


